


Kamtec Inc.
Address : 15, Godeung 2-gil, Iwol-myeon, Jincheon-gun, Chungcheongbuk-do, Republic of Korea
Main Phone : 043-536-7500
Fax : 043-530-3863
Copyright 2021 KAMTEC INC. All rights reserved.
ESG
From product design and manufacturing to service activities, Kamtec establishes an eco-friendly management system and fulfills its responsibilities.
| Classification | Unit | 2022 | 2023 | 2024 | 2025 | ||
|---|---|---|---|---|---|---|---|
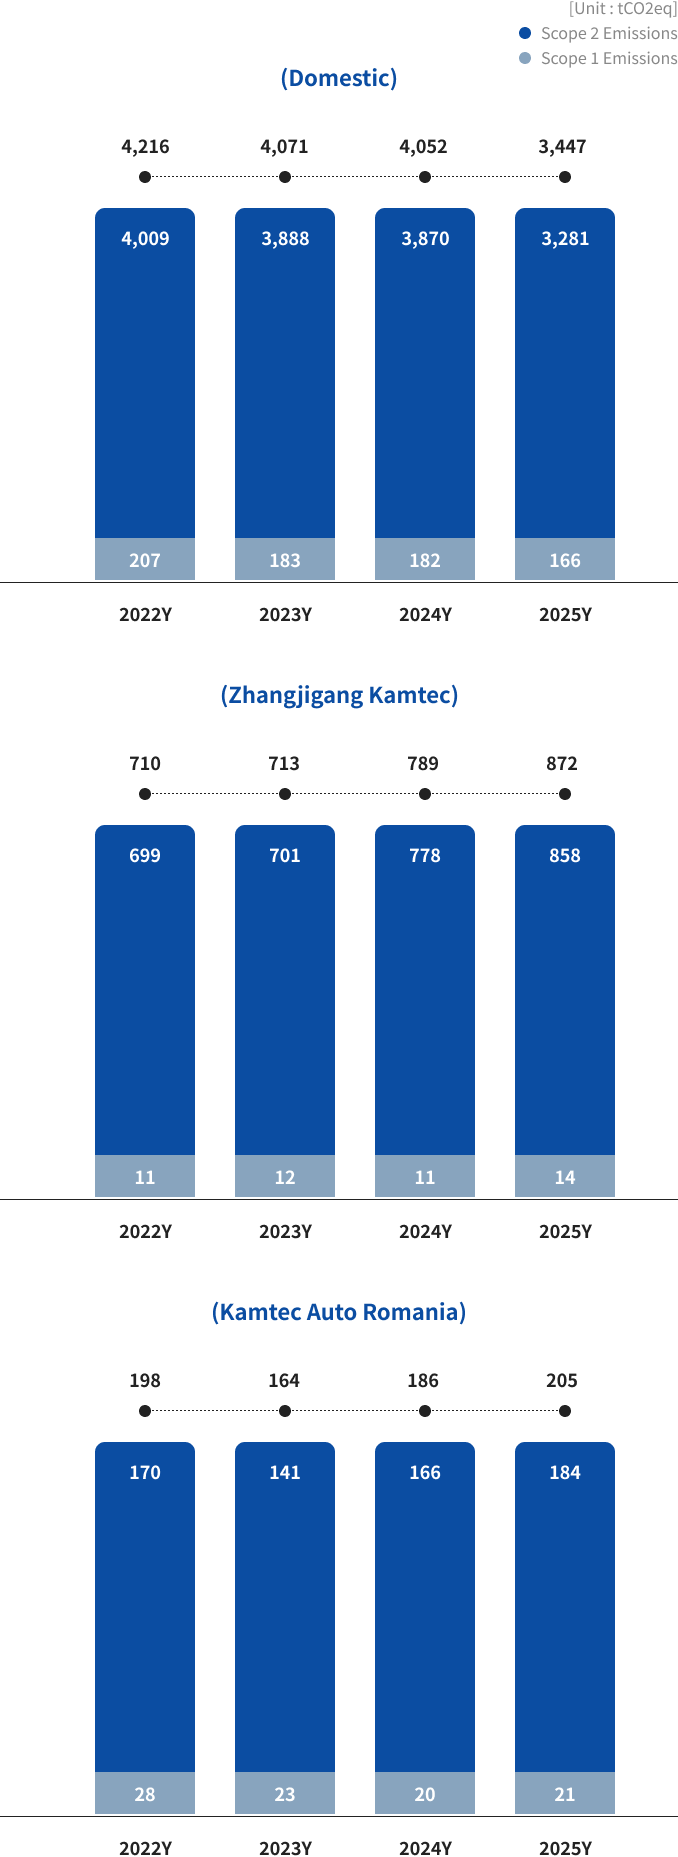
| Greenhouse Gas | Korea | Total GHG Emissions (Scope 1+2) |
tCO2eq |
4,216 |
4,071 |
4,052 |
3,447 |
| └ Direct GHG Emissions (Scope 1) |
tCO2eq |
207 |
183 |
182 |
166 |
||
| └ Indirect GHG Emissions (Scope 2) |
tCO2eq |
4,009 |
3,888 |
3,870 |
3,281 |
||
| GHG Emissions Intensity (Scope 1+2) |
kgCO2eq/ea |
0.379 |
0.596 |
0.339 |
0.273 |
||
| GHG Emissions per Unit of Revenue (Scope 1+2) |
tCO2eq/Million KRW |
1.852 |
1.787 |
1.676 |
1.411 |
||
| China | Total GHG Emissions (Scope 1+2) |
tCO2eq |
710 |
713 |
789 |
872 |
|
| └ Direct GHG Emissions (Scope 1) |
tCO2eq |
11 |
12 |
11 |
14 |
||
| └ Indirect GHG Emissions (Scope 2) |
tCO2eq |
699 |
701 |
778 |
858 |
||
| GHG Emissions Intensity (Scope 1+2) |
kgCO2eq/ea |
0.282 |
0.200 |
0.232 |
0.183 |
||
| GHG Emissions per Unit of Revenue (Scope 1+2) |
tCO2eq/Million KRW |
2.995 |
2.138 |
2.353 |
2.056 |
||
| Romania | Total GHG Emissions (Scope 1+2) |
tCO2eq |
198 |
164 |
186 |
205 |
|
| └ Direct GHG Emissions (Scope 1) |
tCO2eq |
28 |
23 |
20 |
21 |
||
| └ Indirect GHG Emissions (Scope 2) |
tCO2eq |
170 |
141 |
166 |
184 |
||
| GHG Emissions Intensity (Scope 1+2) |
kgCO2eq/ea |
0.583 |
0.257 |
0.160 |
0.094 |
||
| GHG Emissions per Unit of Revenue (Scope 1+2) |
tCO2eq/Million KRW |
2.605 |
1.733 |
1.071 |
0.590 |
||
| Energy | Korea | Total Energy Consumption |
TJ |
34,840 |
33,474 |
33,264 |
31,000 |
| └ Direct Energy Consumption |
TJ |
3,403 |
3,001 |
2,944 |
2,688 |
||
| └ Indirect Energy Consumption |
TJ |
31,437 |
30,473 |
30,320 |
28,312 |
||
| Energy Intensity |
TJ/ea |
0.003 |
0.003 |
0.003 |
0.002 |
||
| China | Total Energy Consumption |
TJ |
4,437 |
4,499 |
4,954 |
5,761 |
|
| └ Direct Energy Consumption |
TJ |
148 |
165 |
146 |
202 |
||
| └ Indirect Energy Consumption |
TJ |
4,289 |
4,334 |
4,808 |
5,559 |
||
| Energy Intensity |
TJ/ea |
0.002 |
0.001 |
0.001 |
0.001 |
||
| Romania | Total Energy Consumption |
TJ |
2,419 |
2,413 |
2,749 |
2,927 |
|
| └ Direct Energy Consumption |
TJ |
366 |
304 |
272 |
296 |
||
| └ Indirect Energy Consumption |
TJ |
2,053 |
2,109 |
2,477 |
2,631 |
||
| Energy Intensity |
TJ/ea |
0.007 |
0.004 |
0.002 |
0.001 |
||
2024
| Classification | Unit | 2022 | 2023 | 2024 | 2025 | ||
|---|---|---|---|---|---|---|---|
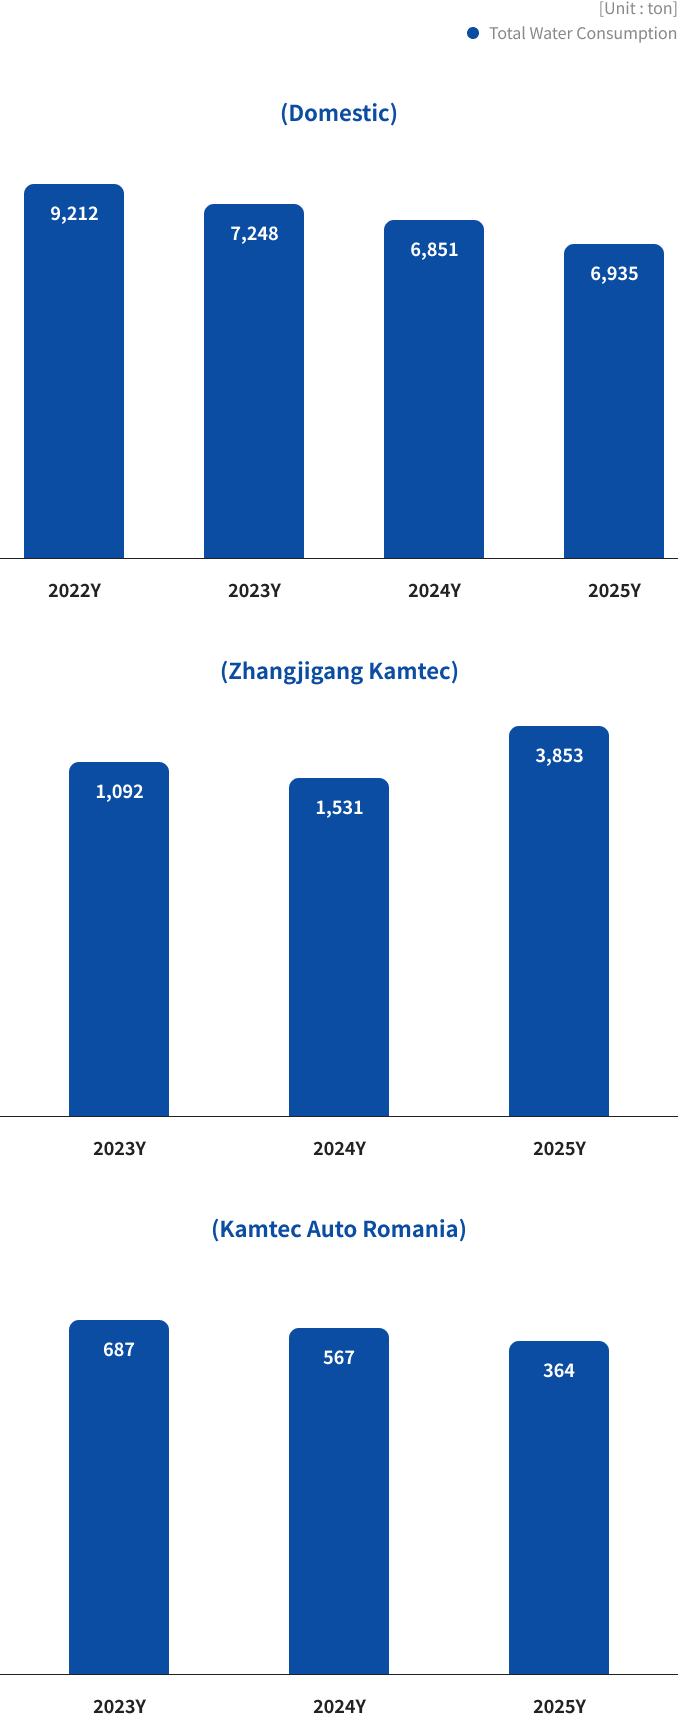
| Water | Korea | Total Consumption | ton | 9,212 | 7,248 | 6,851 | 6,935 |
| Recycled Volume (or Reuse) | ton | - | 10 | 152 | 97 | ||
| Consumption per Employee | ton/Employee | 4.02 | 3.09 | 2.90 | 2.34 | ||
| China | Total Consumption | ton | - | 1,092 | 1,531 | 3,853 | |
| Consumption per Employee | ton/Employee | - | 20.60 | 28.35 | 5.60 | ||
| Romania | Total Consumption | ton | - | 687 | 567 | 364 | |
| Consumption per Employee | ton/Employee | - | 15.61 | 12.91 | 0.55 | ||
| Classification | Unit | Total | Jan. | Feb. | Mar. | Apr. | May. | Jun. | Jul. | Aug. | Sep. | Oct. | Nov. | Dec. | ||
|---|---|---|---|---|---|---|---|---|---|---|---|---|---|---|---|---|
| Water | Korea | Consumption | ton | 6,935 | 417 | 420 | 426 | 550 | 496 | 612 | 956 | 924 | 738 | 482 | 487 | 427 |
| Recycled Volume | ton | 97 | 3 | 3 | 4 | 4 | 2 | 11 | 19 | 29 | 12 | 3 | 3 | 4 | ||
| Recycling Rate | % | 1.4% | 0.7% | 0.7% | 0.9% | 0.7% | 0.4% | 1.8% | 2.0% | 3.1% | 1.6% | 0.6% | 0.6% | 0.9% | ||
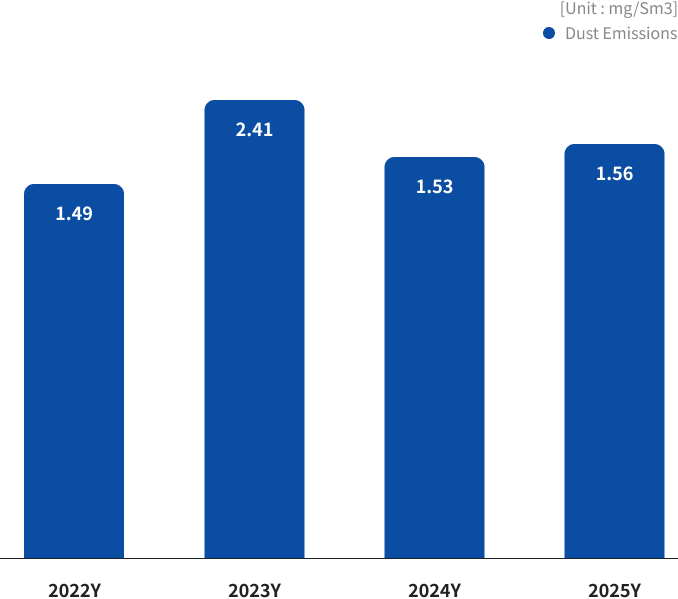
| Classification | Unit | Permissible Limits | 2022 | 2023 | 2024 | 2025 | |
|---|---|---|---|---|---|---|---|
| Water Pollutants | BOD | mg/L | 10 | 0.3 | 0.3 | 0.3 | 0.5 |
| SS | ppm | 10 | 0.5 | 0.5 | 0.5 | 0.2 | |
| Air Pollutants | NOx | ppm | 60 | 44.2 | 46.6 | 48.5 | 40.5 |
| SOx | ppm | 70 | - | - | - | 1.4 | |
| Dust | mg/Sm3 | 30 | 1.5 | 2.4 | 1.5 | 1.6 | |
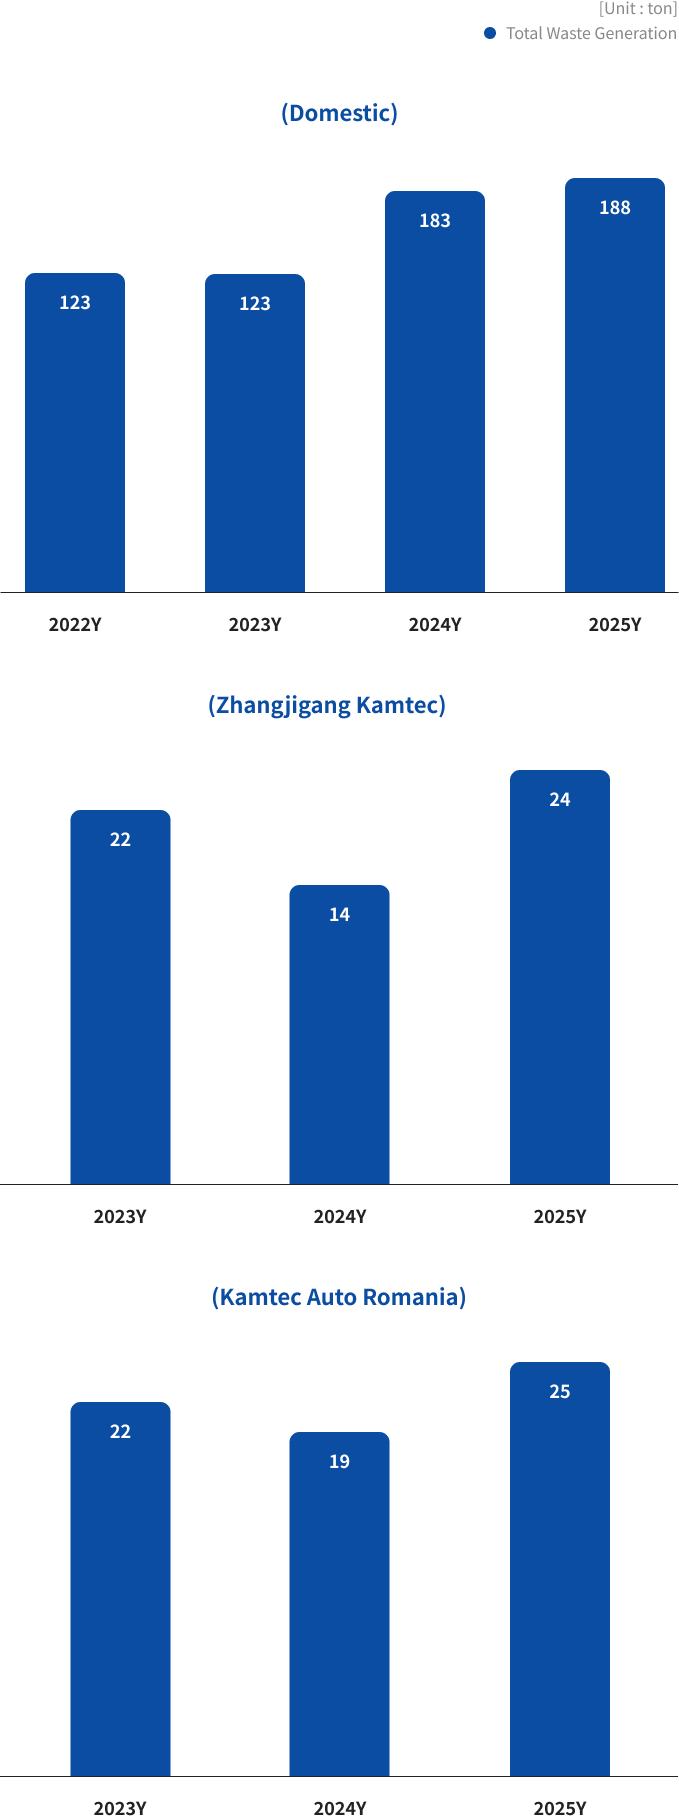
| Classification | Unit | 2022 | 2023 | 2024 | 2025 | ||
|---|---|---|---|---|---|---|---|
| Waste | Korea | Total Waste Generation |
ton |
123 |
123 |
183 |
188 |
| └ Non-hazardous Waste |
ton |
121 |
122 |
183 |
188 |
||
| └ Recycled Waste | ton | - | - | 107 | 115 | ||
| └ Recycling Rate | % | 0% | 0% | 58% | 61% | ||
| └ Hazardous Waste |
ton |
1.15 |
1.00 |
0.25 |
0.40 |
||
| └ Recycled Waste | ton | - | - | 0.25 | 0.25 | ||
| └ Recycling Rate | % | 0% | 0% | 100% | 63% | ||
| └ Wastewater | ton | 1 | - | - | - | ||
| Waste Generation Intensity | kg/ea | 0.019 | 0.018 | 0.027 | 0.025 | ||
| China | Total Waste Generation | ton | - | 22 | 14 | 24 | |
| └ Non-hazardous Waste |
ton |
- | 22 | 14 | 24 | ||
| └ Hazardous Waste |
ton |
- | - | - | - | ||
| Waste Generation Intensity | kg/ea | - | 0.016 | 0.009 | 0.005 | ||
| Romania | Total Waste Generation | ton | - | 22 | 19 | 25 | |
| └ Non-hazardous Waste |
ton |
- | 22 | 19 | 25 | ||
| └ Hazardous Waste |
ton |
- | - | - | - | ||
| Waste Generation Intensity | kg/ea | - | 0.039 | 0.016 | 0.010 | ||
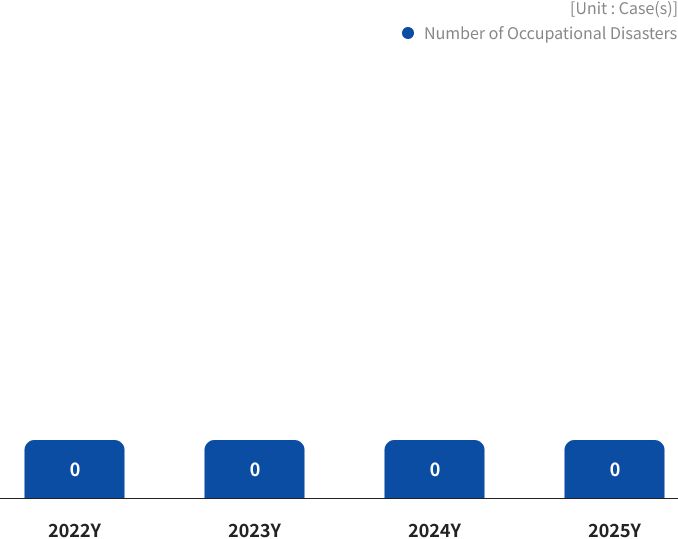
| Classification | Unit | 2022 | 2023 | 2024 | 2025 |
|---|---|---|---|---|---|
|
Number of Occupational Disasters |
Case(s) | 0 | 0 | 0 | 0 |